Once signed in to the QMENTA Platform, you will land on the dashboard page which looks similar to the next figure.
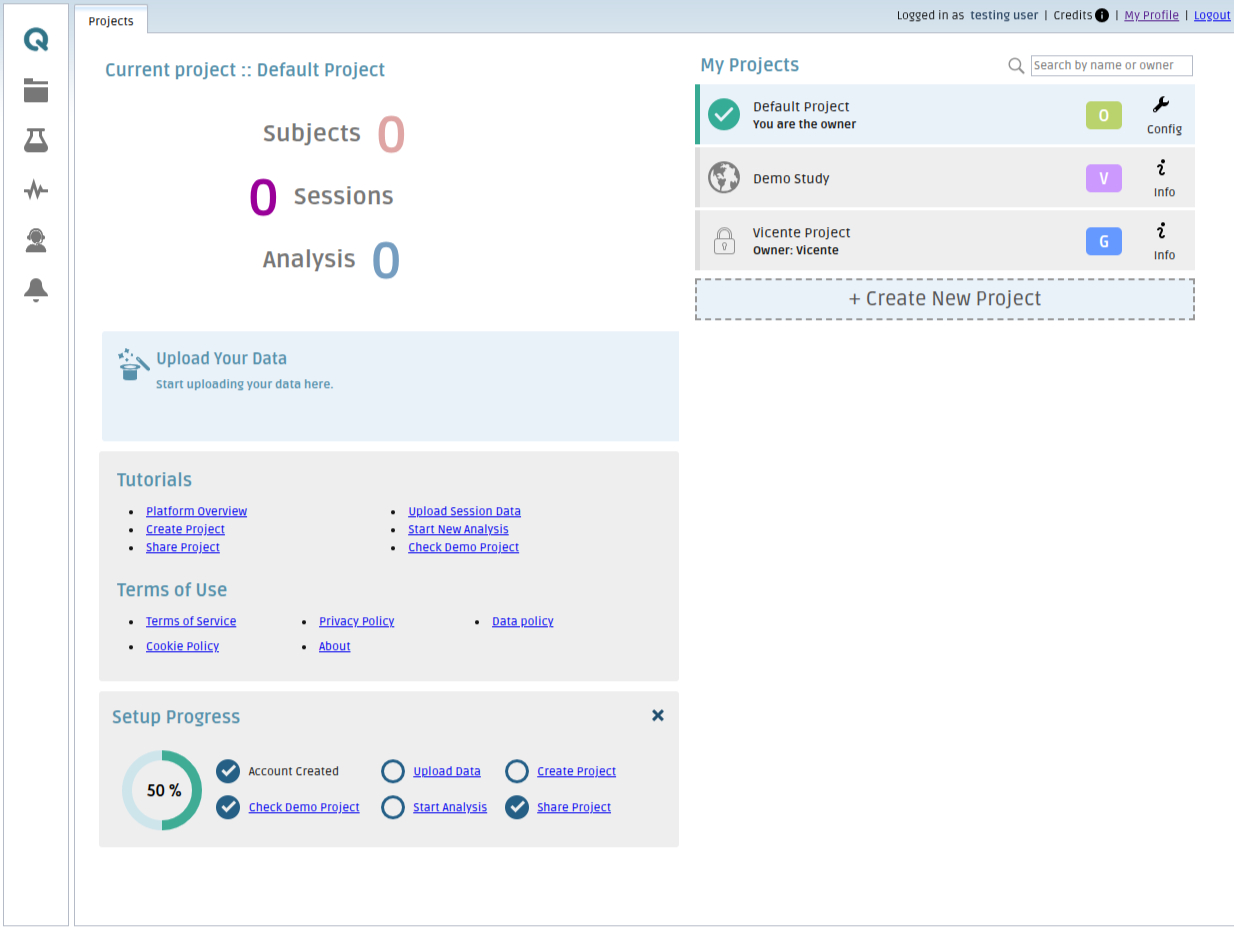
On the right-hand side of the Dashboard you have the list of projects you have access to (“My Projects”). The first project in the list is the active one, which is also shown on the middle of the page next to: “Current project”. On the list of projects:
- You can hover the mouse over the project name to see the unique identification number of the project.
- The initials to the right of the project name indicates your role. You can hover the mouse over the initials to see your exact role (PM: Project Manager in the active project from the figure above).
If your role is one of:
- “Owner” or “Project Admin”, you can click the “Config” key and edit the project details as explained in Projects. With these roles you can also invite collaborators and/or modify their roles. See more about roles in the Roles and Permissions article.
- “Collaborator”, “Data Admin” or “Guest” you can click the “Info” key and visualize certain project information such as the participants, the description, and the project duration.
In the middle of the Dashboard you can see basic information about the current active project such as: number of subjects, sessions, and analyses executed. A pie-chart with the modality distribution within the project is available.
Clicking “Upload Your Data”, a pop-up window will appear where you can drag and drop a zip file to be uploaded to the active project. See further information in the Upload data article.
At the bottom of the page, there are links to additional tutorials covering the basic usage of the QMENTA Platform and certain policy information. Further below, there is also “Setup Progress”. That is, a set of steps you have completed so far towards fully setting up your account in the QMENTA Platform.
On the left sidebar on the dashboard, you can find the QMENTA logo alongside five clickable icons:
- “Data”: The folder icon. This will open a new tab where you can manage the active project data. This is explained in detail in the Upload data article.
- “Analyses”: The flask icon. This will open a new tab where you can manage the active project analyses. This is explained in detail in the Run analysis article.
- “Activity”: The sawtooth line. This will open a pop-up window with a list of ongoing activities your user is currently performing in the QMENTA Platform. These can be from uploading data to deleting analysis
- “Support”: The human icon. This will open a chat window where you can contact QMENTA’s support team in real time during business hours (CET).
- “Alerts”: The bell icon. This will open a new tab (‘Notification Center’) showing a list of notifications, such as updates regarding the QMENTA Platform or password reset reminders.
In the top right corner, “My Profile” will open a new browser window where you can edit your user information.
For information on the "Credits" icon, go to the following article.
Finally, you can logout of the Platform by clicking the “Logout” link in the top right corner