To visualize the results of an analysis from the platform, you will use the Papaya program. Here we summarize how to launch it and what kind of options it contains.
First of all, you will have to log into the platform, choose a project that contains an analysis or start a new one. After this, you should click on 'My analysis' and then select an analysis. The last step to start the image browser is to click on ‘Show results’ under 'Results'. For a more detailed description please click on this link.
Now, you will see a new window which shows you the selected analysis result.
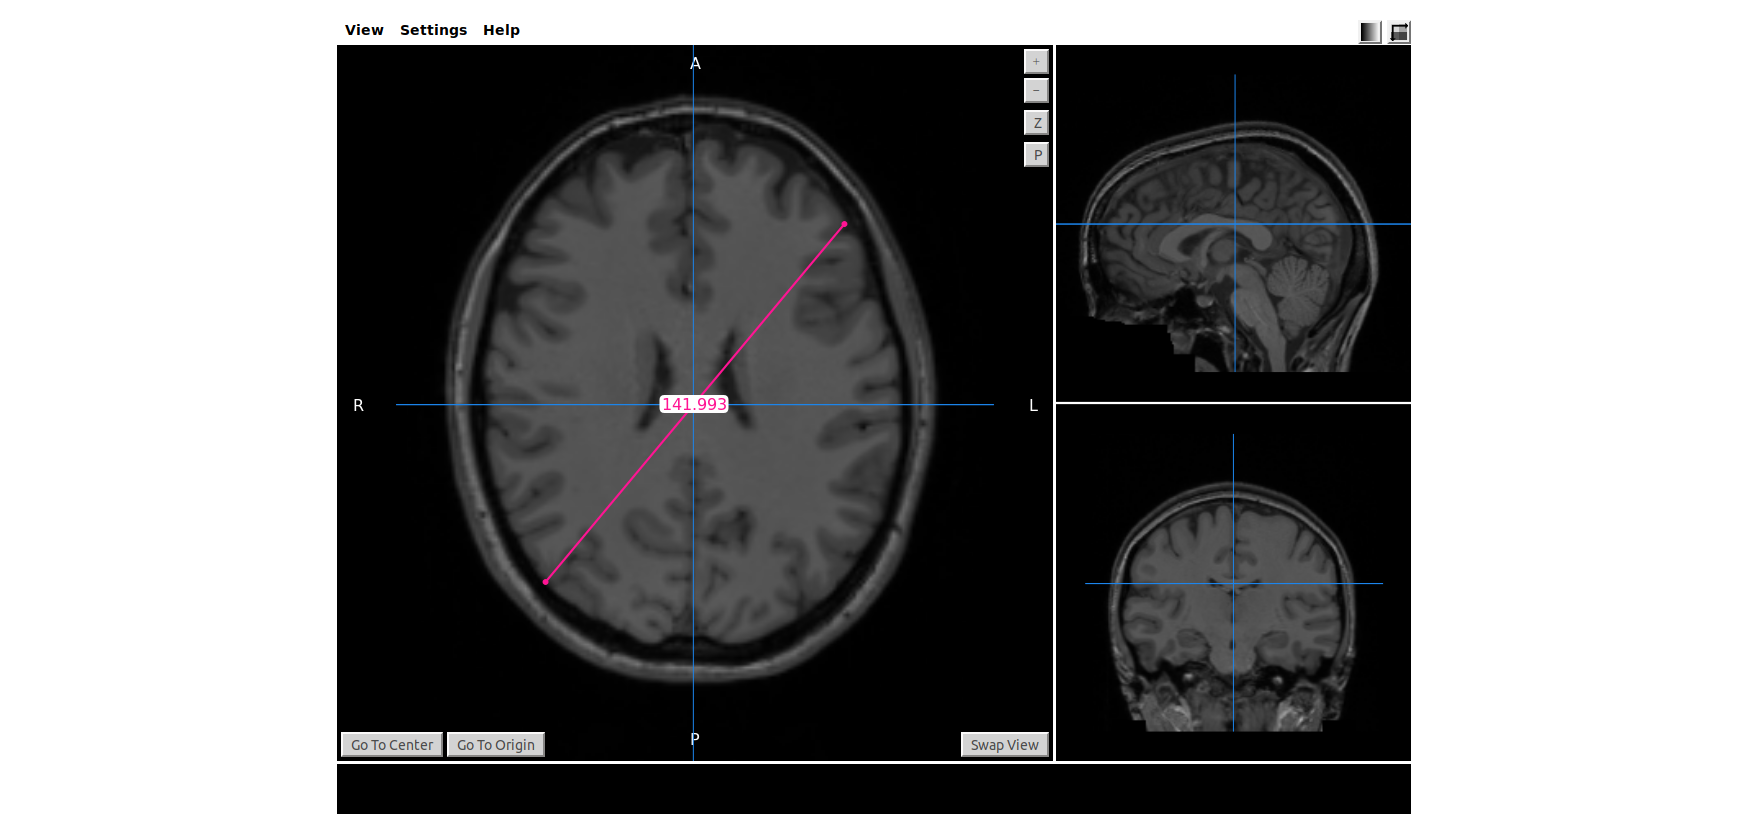
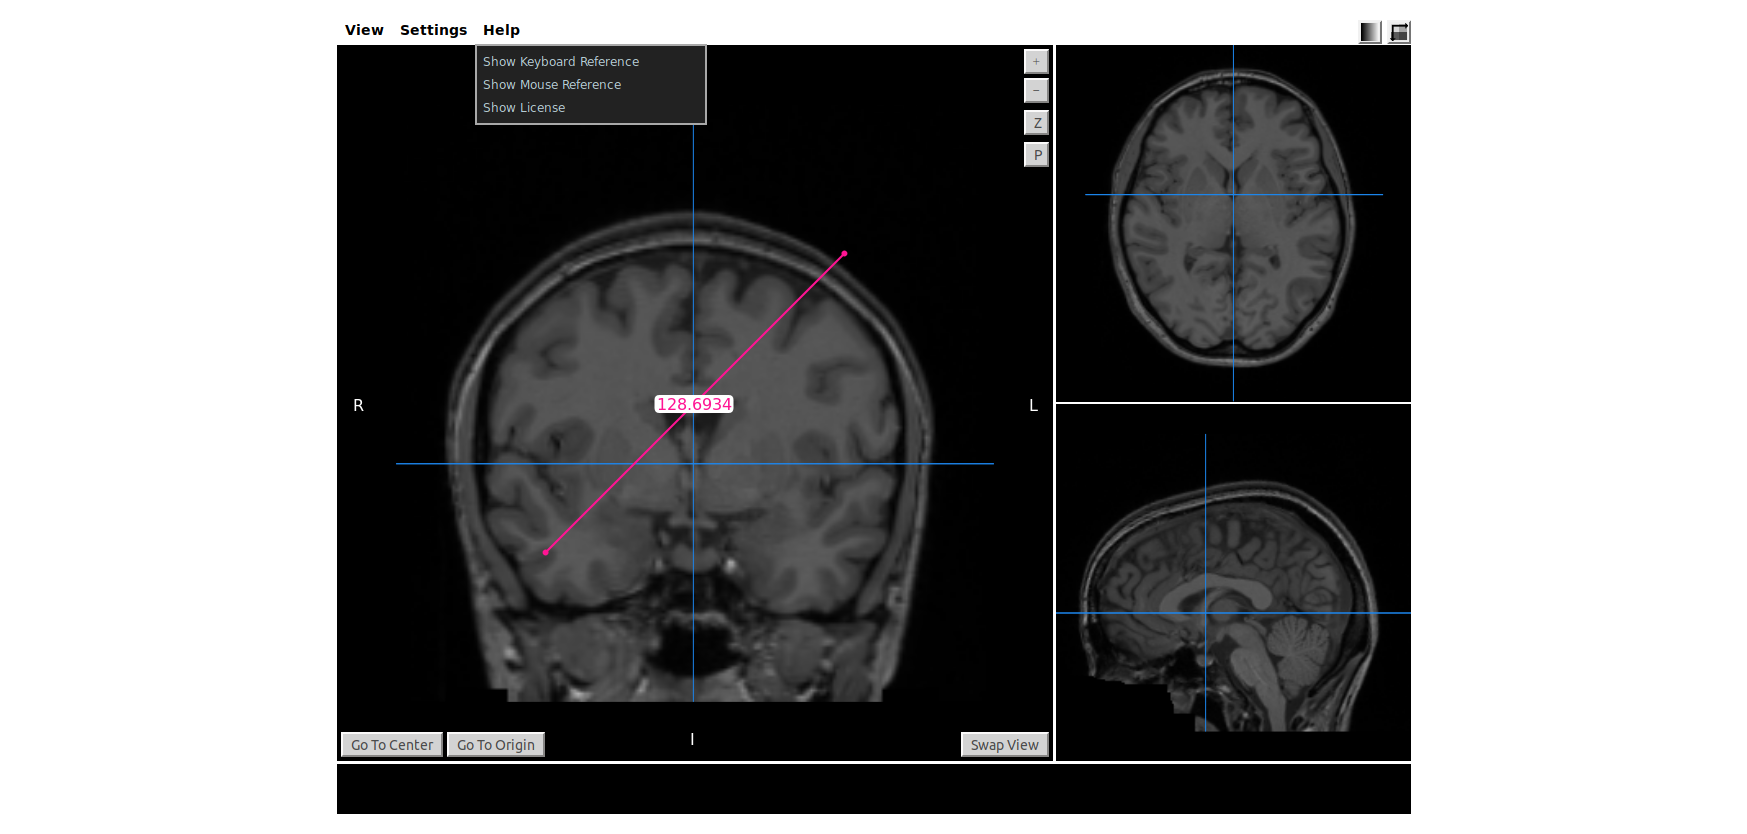
By default, the coordinates are in the center. (You can reach this position anytime by clicking on 'Go to Center'). 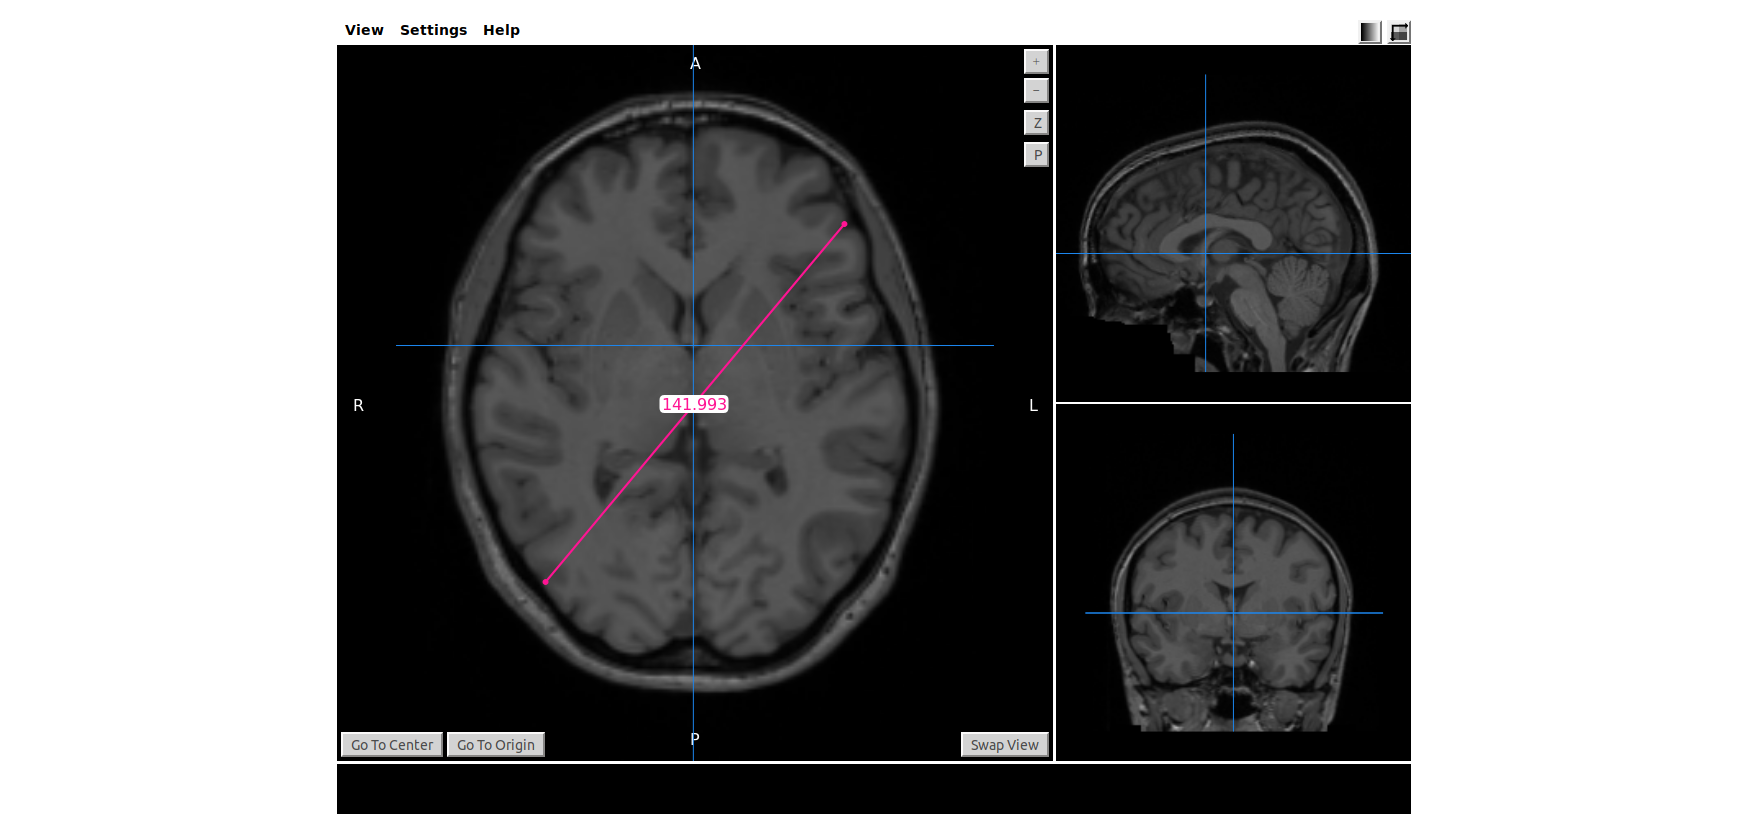
With the help of the 'Swap view' button, you can exchange the order of the pictures to be able to see the slices of each orientation in the largest view.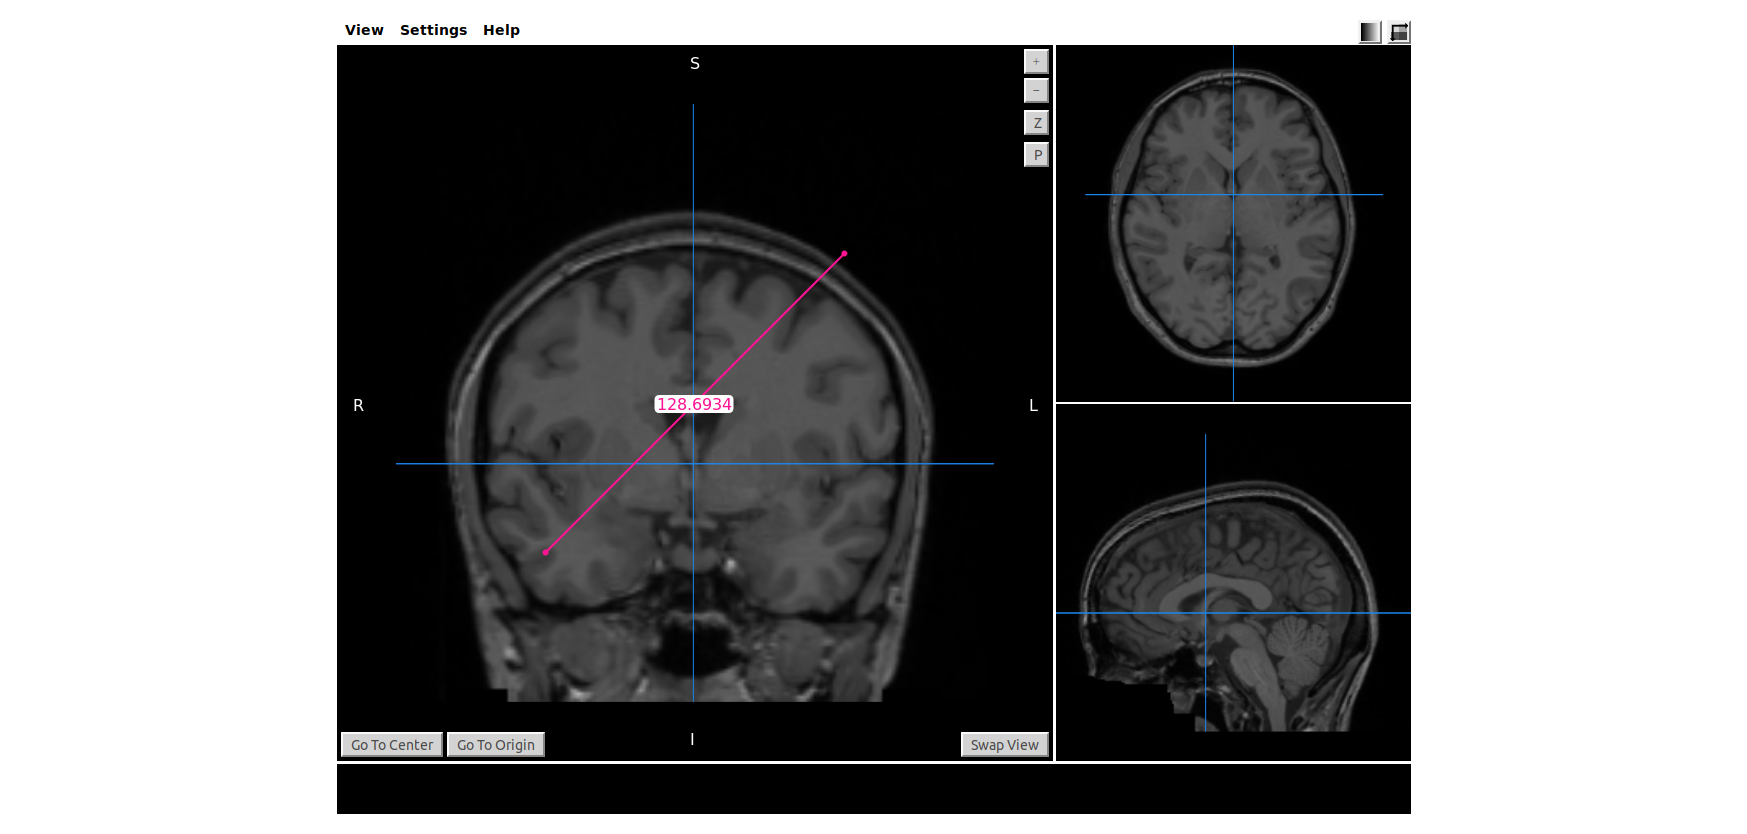
At the top of the program, you can see 'View', 'Settings' and 'Help' menus which helps you to understand and better customize your images.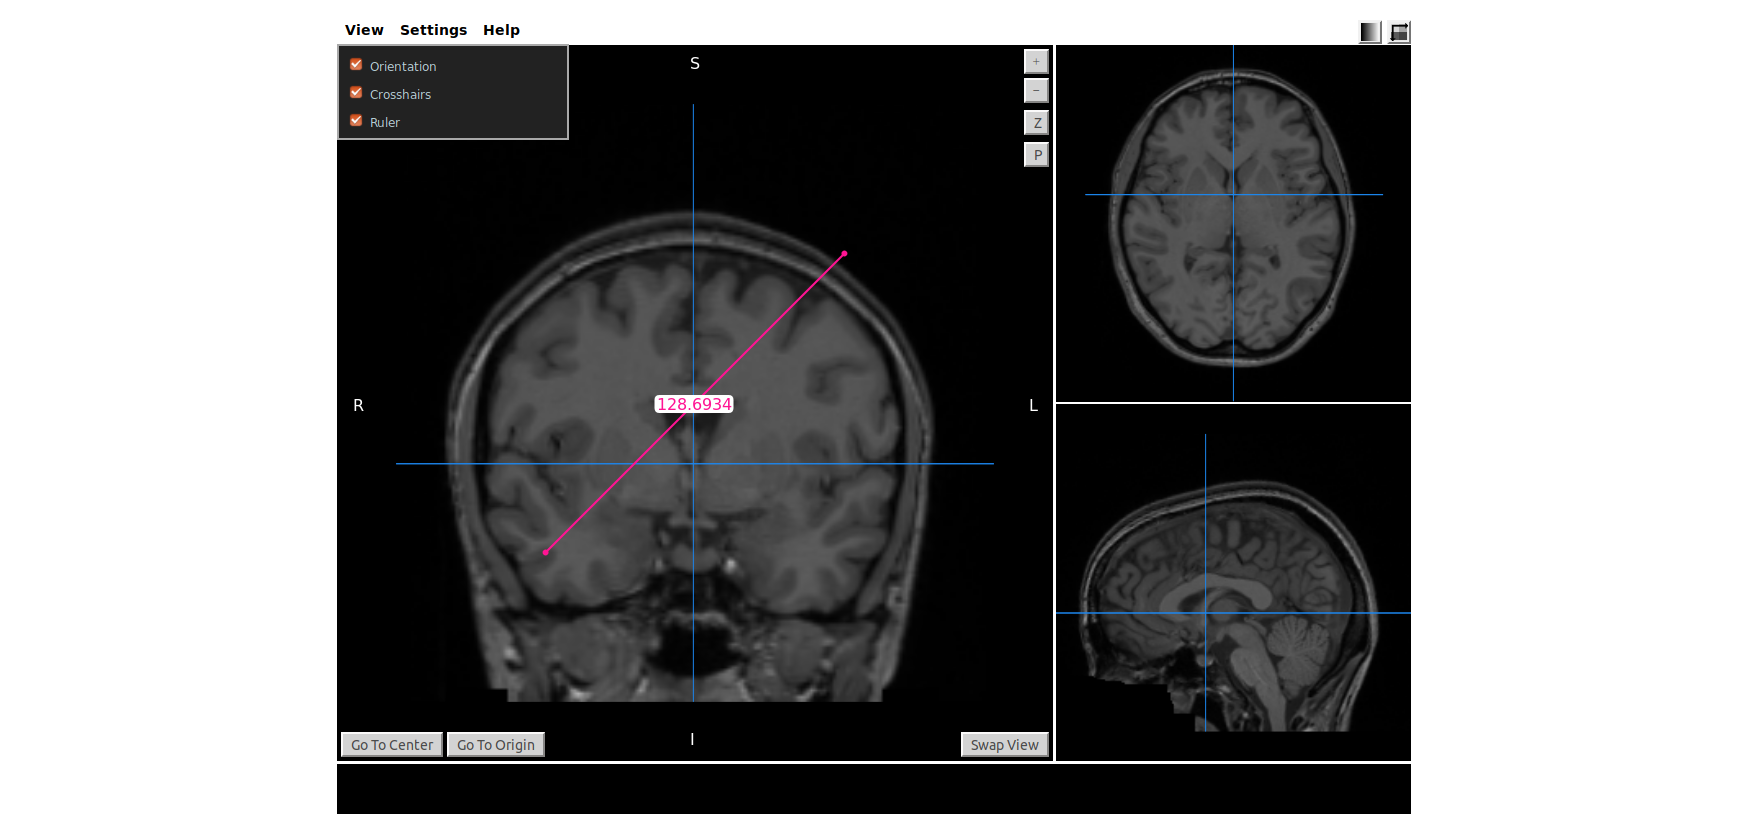
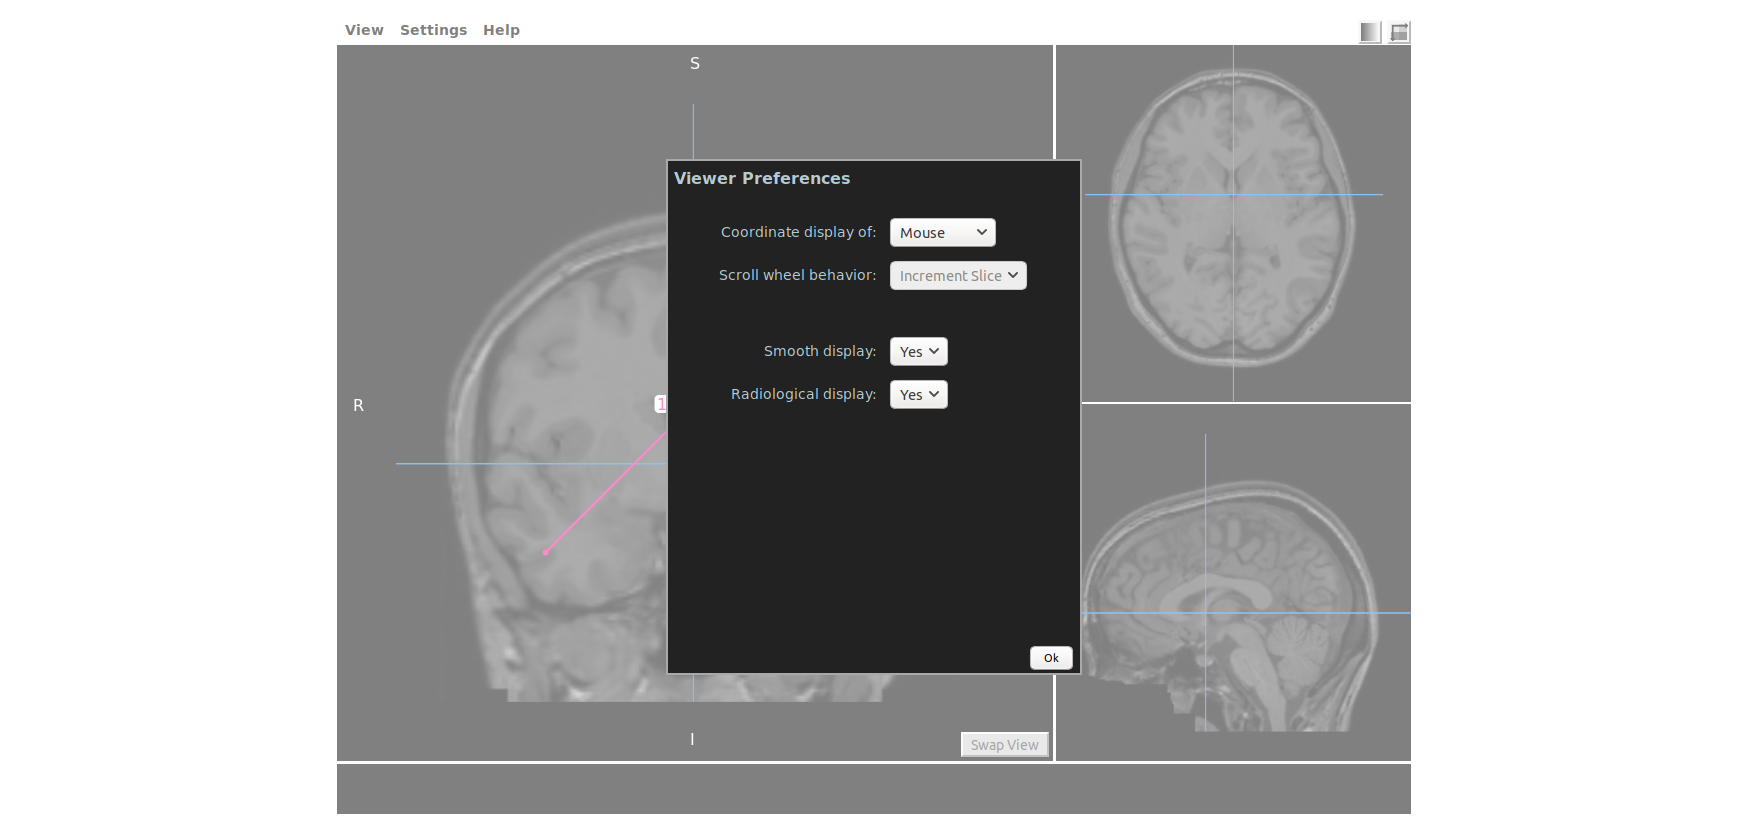
There are two other useful options. In the right upper corner, you can change both the color of the images and the coordinate system. 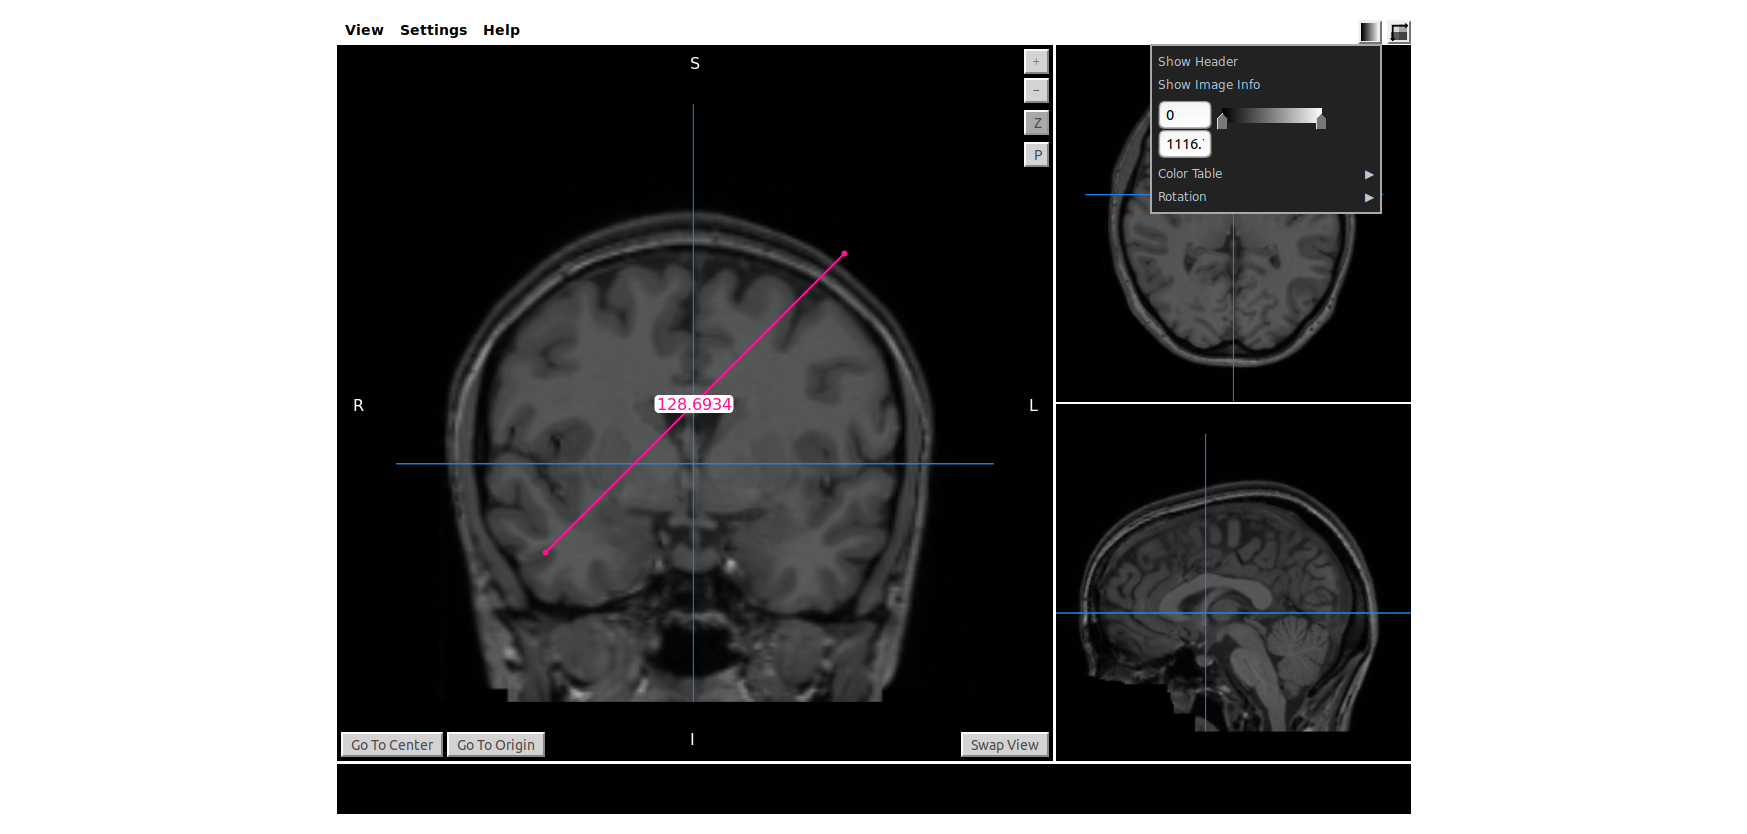

Create free account now!