Quantitative susceptibility mapping (QSM) is a technique used to estimate the magnetic susceptibility of tissues, which causes subtle variations in the magnetic field. By mapping this property, one can quantify tissue iron concentration and vessel oxygen saturation.
QMENTA's QSM pipeline computes quantitative susceptibility maps using both phase and magnitude images and is based on tools developed by qMRLab. The pipeline uses the Split-Bregman method. For more information on the methods used, see here.
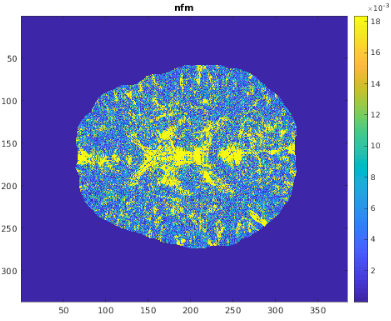
Example results

Required inputs
- Wrapped phase image
- 3D GRE acquisition (wrapped phase image)
- Must have tag 'phase'
- Magnitude image
- 3D GRE acquisition (magnitude part of image)
- Must have tag 'magnitude'
- Brain mask
- Brain extracted anatomical image in same space as input images.
- Must have tag 'mask'
This analysis only accepts single Echo Time input data. All volumes should be acquired with the same TE.
Outputs
- FitResults.mat: Results matrix, containing all outputs as workspace variables.
- chiL2: Susceptibility map created using L2 regularization without
magnitude weighting - chiSB: Susceptibility map created using Split-Bregman method without
magnitude weighting. - maskOut.nii.gz: Binary mask (maskSharp, gradientMask or same as the input).
- unwrappedPhase.nii.gz: Unwrapped phase image using Laplacian-based method.
Typical execution time
- < 10 minutes
References
- Bilgic et al. (2014), Fast quantitative susceptibility mapping with
L1-regularization and automatic parameter selection. Magn. Reson. Med.,
72: 1444-1459. doi:10.1002/mrm.25029 - Karakuzu A., Boudreau M., Duval T.,Boshkovski T., Leppert I.R., Cabana J.F.,
Gagnon I., Beliveau P., Pike G.B., Cohen-Adad J., Stikov N. (2020), qMRLab:
Quantitative MRI analysis, under one umbrella doi: 10.21105/joss.02343