Imaging studies often examine the brain over long periods of time to see how the underlying structure and functions are affected by age, treatments, disease progression or any other variables.
To visualize the effects of variables over time, we have introduced "Longitudinal statistics", which allows plotting the correlation between any variable and the sessions of image acquisitions. You can obtain the figure with just one click, without installing or maintaining any statistical software.
Open Longitudinal statistics
- Click the "Data" tab
- Click "Data Insights / Longitudinal Statistics"
Select fields
- Select a field for the X-Axis (e.g. Sequential timepoint to browse the evolution of the Y-Axis variable over time)
- Select a field for the Y-Axis (imaging biomarker or clinical scores)
- Click Show
When you want to use cumulative values on the X-Axis, check "Cumulative X"
Plot
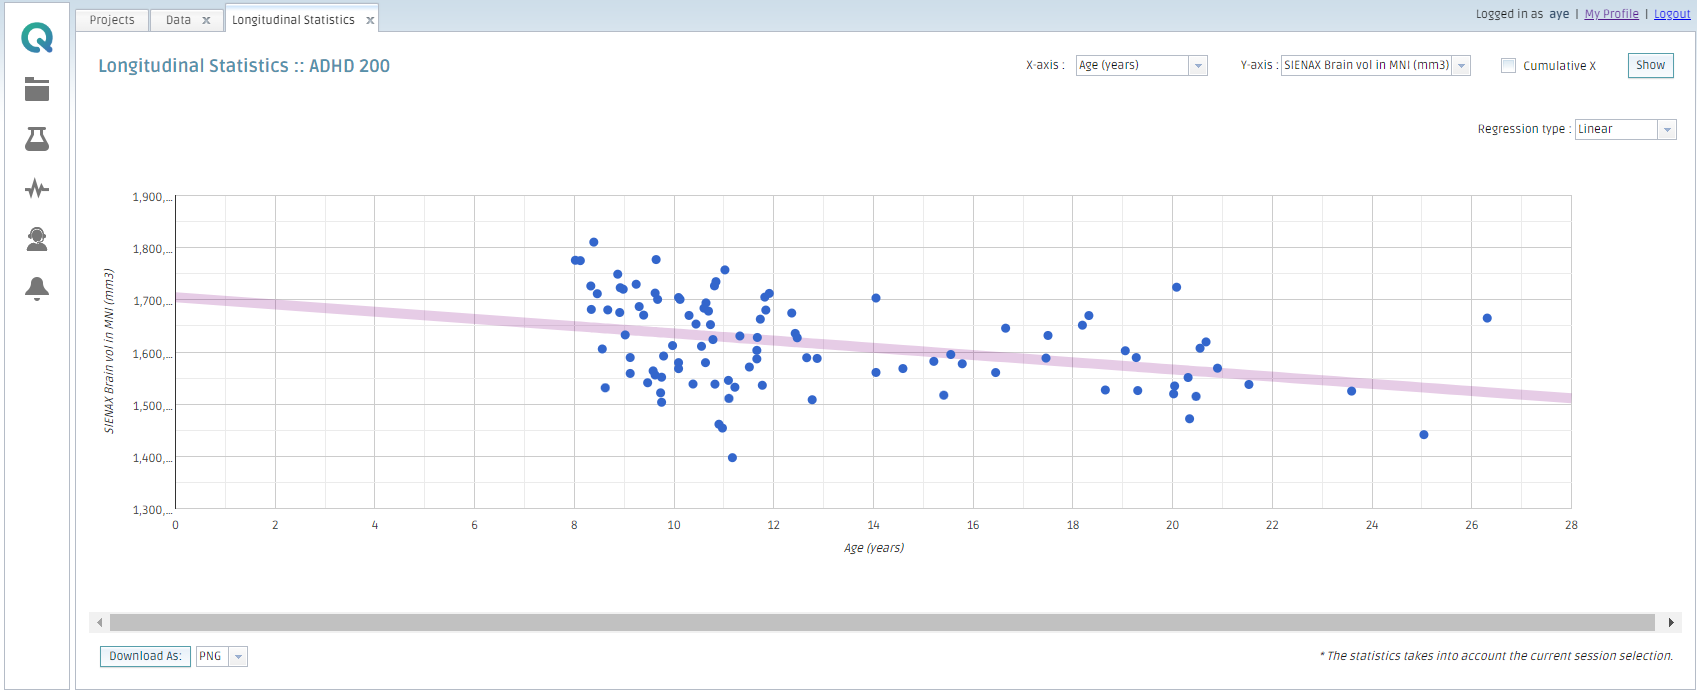
A scatter plot is automatically generated with a regression line.
You can select the method of regression; linear (straight), exponential or polynomial.
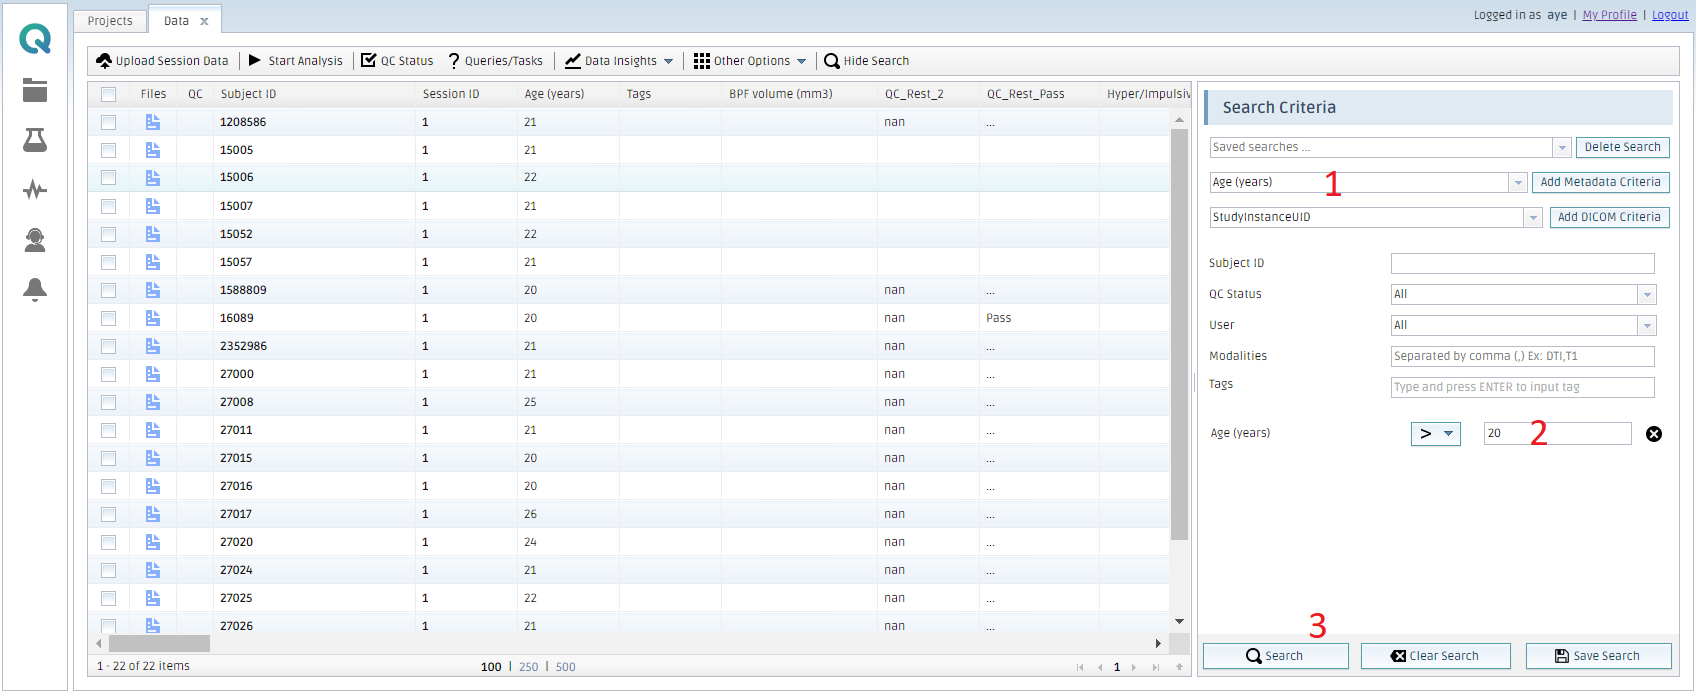
Filtering data
When you filter data in My Data, that filter is applied to Longitudinal statistics too.
- Add a field to set search criteria if it is not listed
- Enter search criteria
- Click Search
Then, open Longitudinal statistics to make a plot with filtered data.
Filtering applies to any new plots which are subsequently created, existing plots will not be lost.
Create free account now!