Neuroimaging studies include clinical scores, demographic information, behavioral data and many other kinds of metadata. It is crucial for researchers to analyze the characteristics of the scores and find the relationships between the scores and imaging biomarkers.
To quickly understand the characteristics of the scores, we have introduced the metadata statistics feature. You can make a plot in one click without installing or maintaining any statistical software. The type of plot is automatically determined, such as a circle plot, histogram or scatter plot. The plot can also be downloaded as picture (.png) or file (.csv).
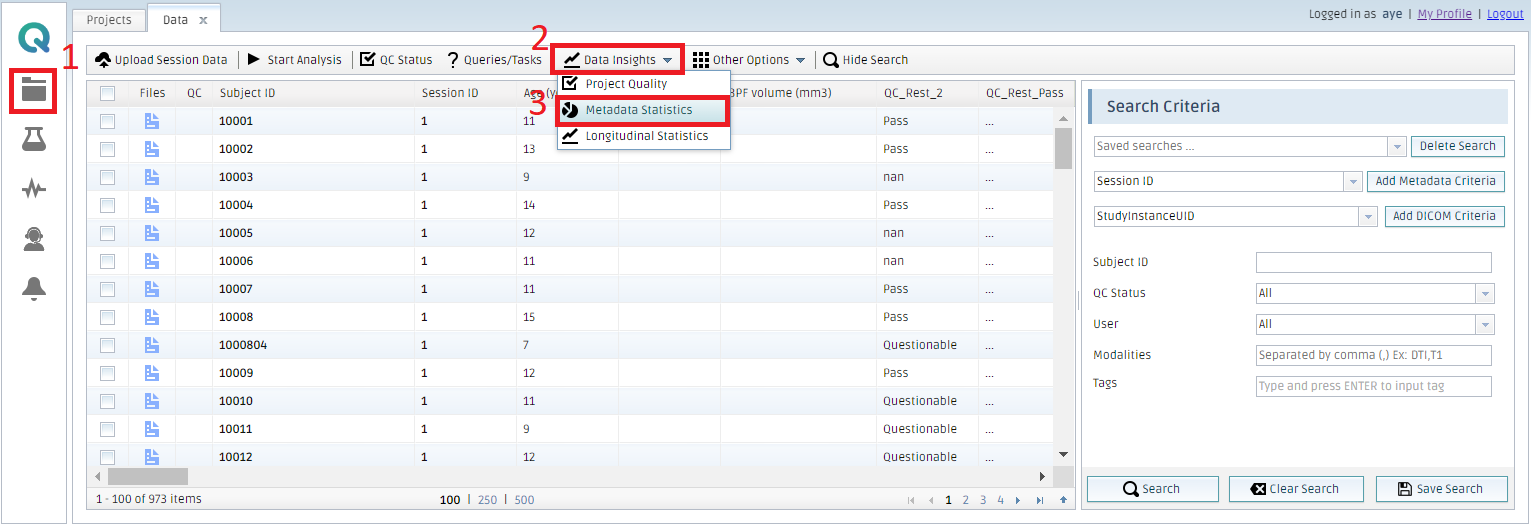
Open Metadata statistics
- Click the "Data" tab
- Click "Data Insights"
- Click "Metadata Statistics"
Select a field
- Select a Field
- Click Add Field
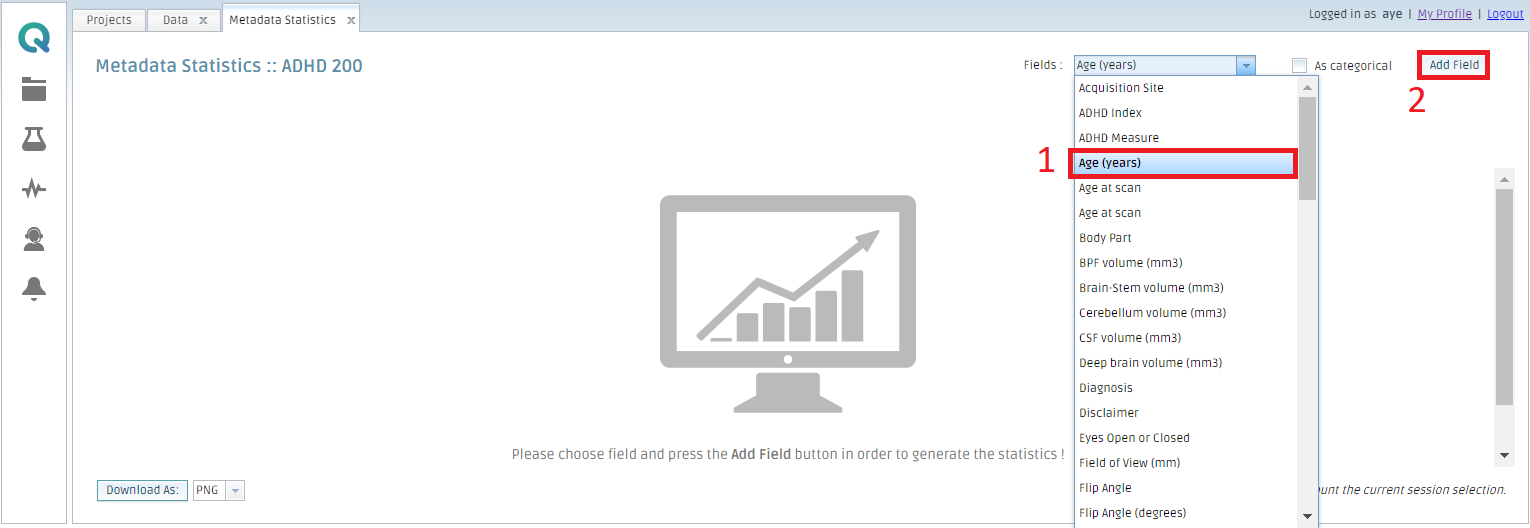
You can add a field as you want. The plots are automatically generated based on the data type.
When you want to treat numerical values as categorical, you can check "As categorical"
Histogram
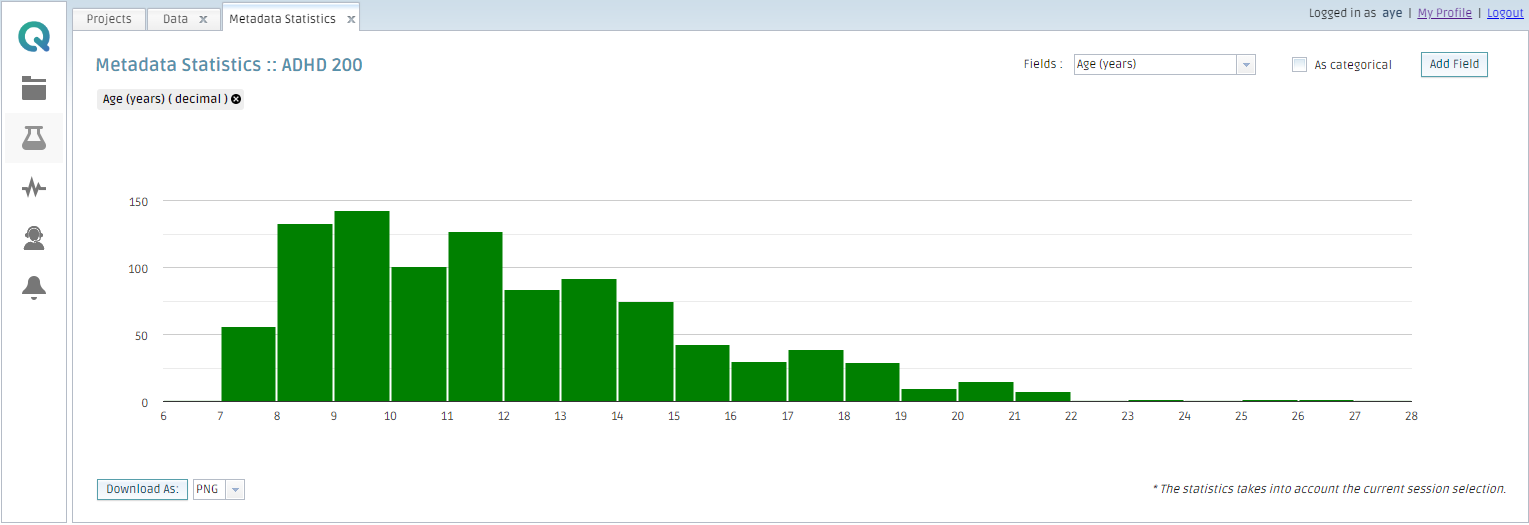
When you select numerical data, a histogram is shown.
You can download the data as a picture (.png) or file (.csv)
Scatter plot
When you select multiple fields, a scatter plot is displayed with a regression line.
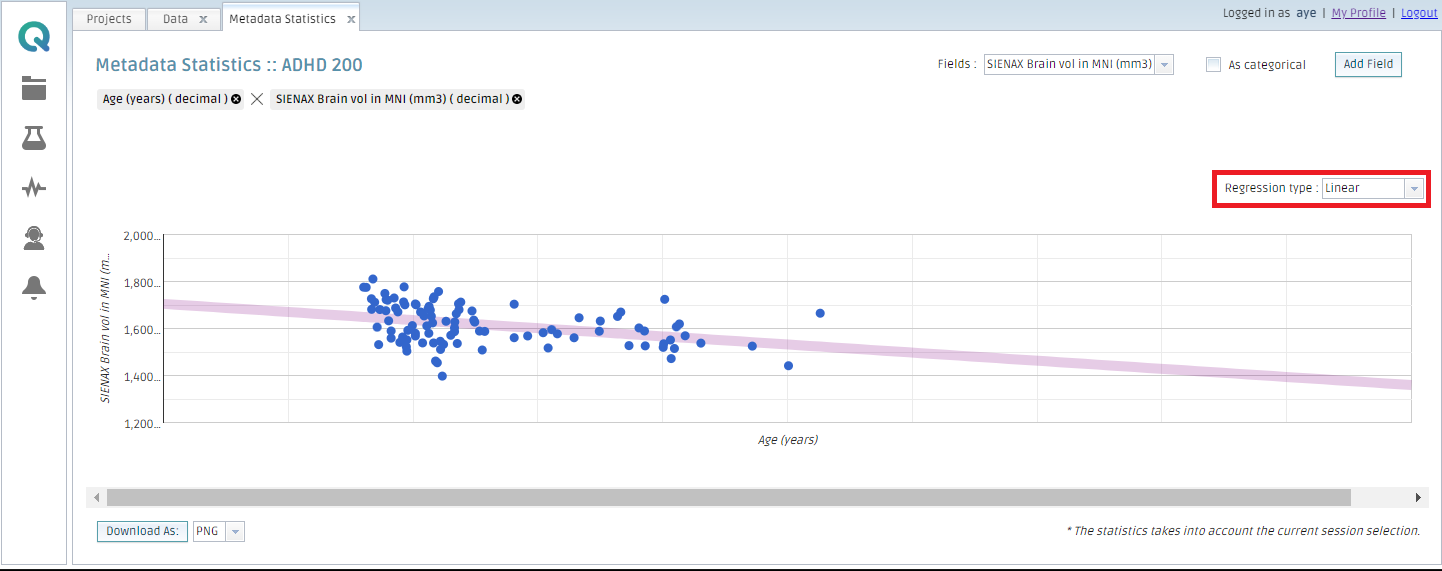
You can select the method of regression: linear (straight), exponential or polynomial.
If you add more than two fields, the scatter plots for every combination of the fields are presented.
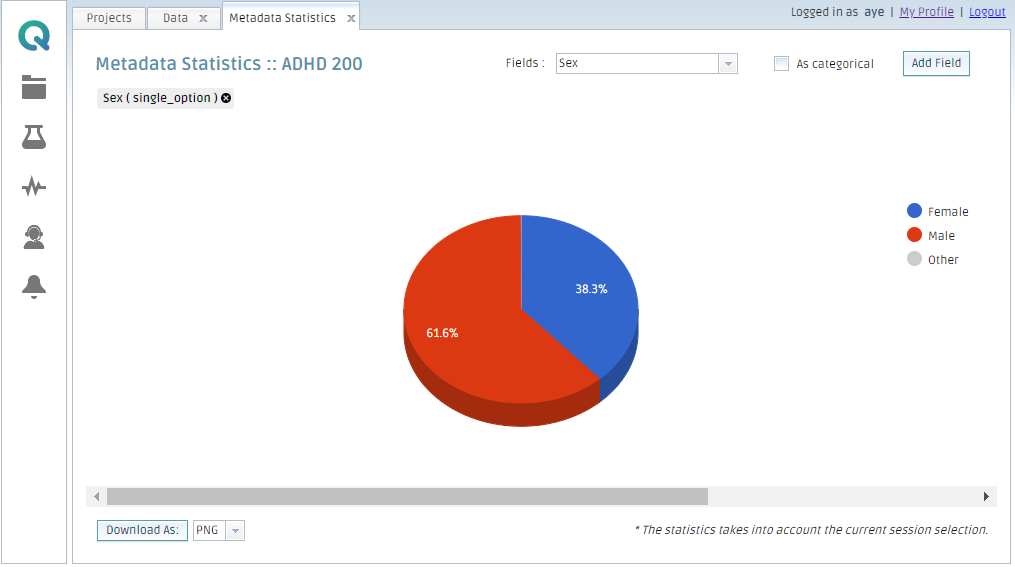
Pie Chart
When you select categorical data, a pie chart is shown to see the percentage of each category.
Filtering data
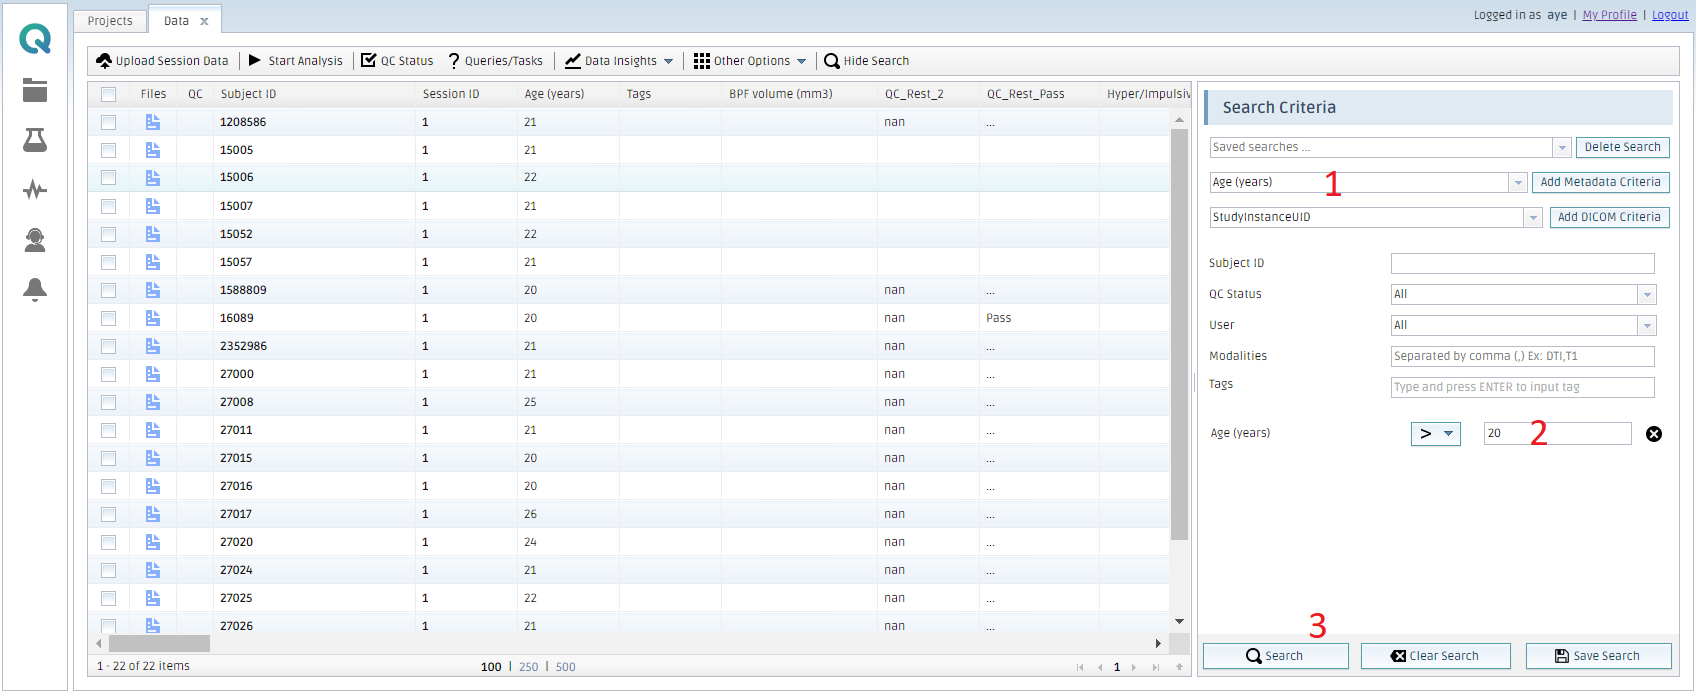
When you filter data in My Data, that filter is applied to Metadata statistics too.
- Add a field to set search criteria if it is not listed
- Enter a search criterion
- Click Search
Then, open Metadata statistics to make a plot with filtered data.
Filtering applies to any new plots which are subsequently created; existing plots will not be lost.
Create free account now!