The project quality feature automatically generates a report for the modality distribution and MRI parameters in one project to see an overview of the acquired data and quickly find data anomalies.
The steps to show the project quality check are described below.
- Click on the ‘My Data’ tab
- Click on the ‘Project Quality’ (please find the detailed description below)
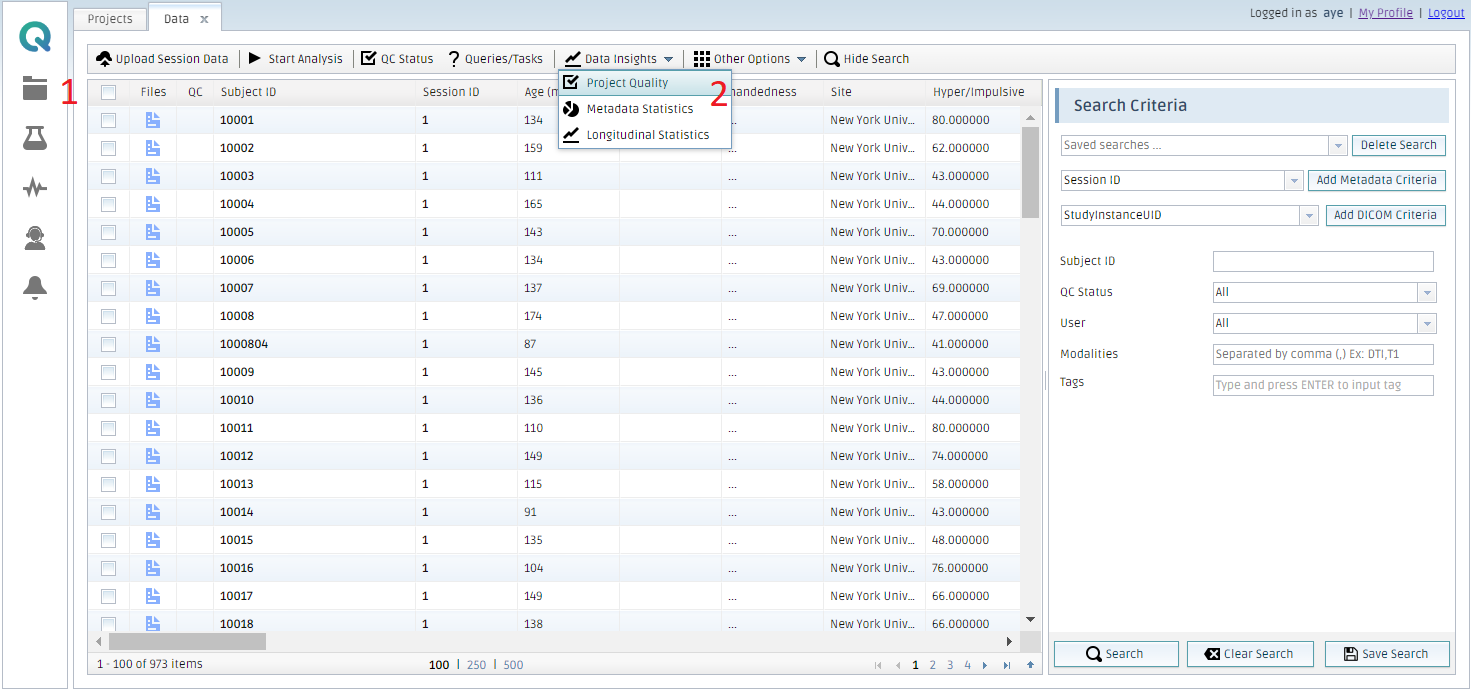
This new window will appear: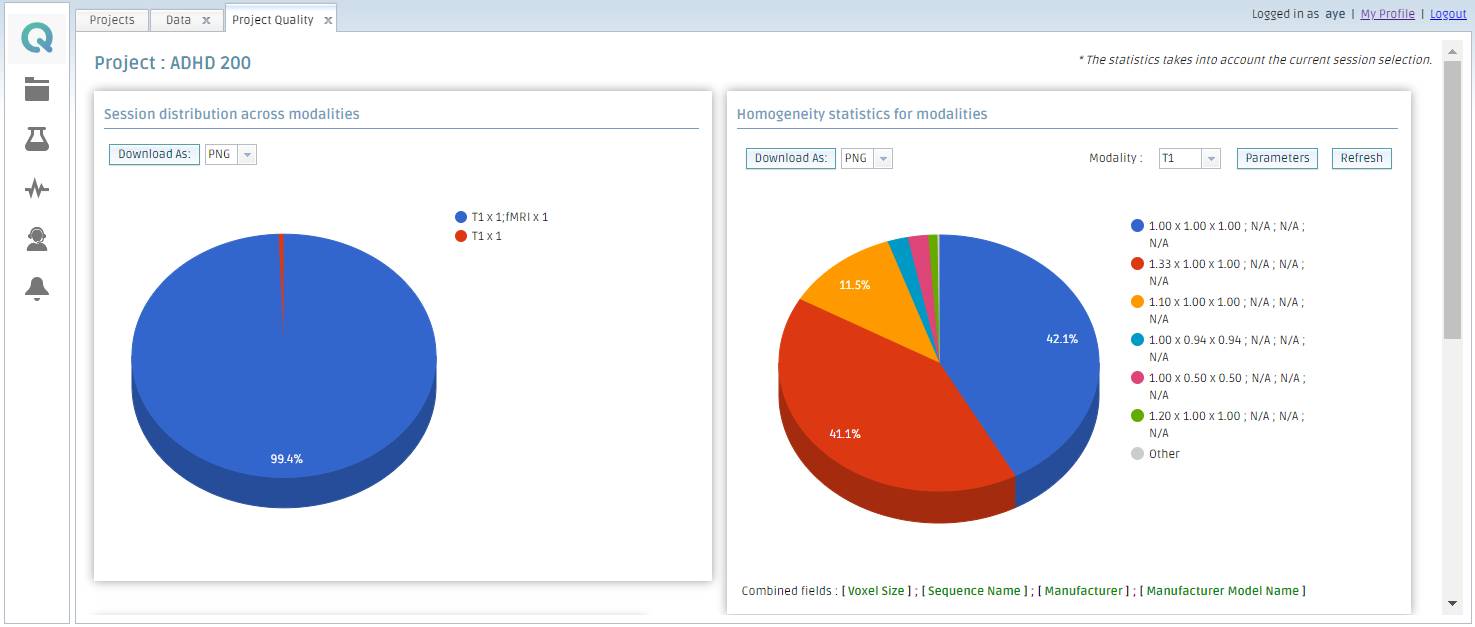
The four sections of the Project Quality check
The project quality check contains four sections. All plots can be downloaded as a picture (png) or a file (CSV).
1. Session distribution across modalities
While conducting your neuroimaging research, you will likely acquire a specific number of files of each modality for each subject, e.g. one T1 file and two fMRI files. However, files can be lost for various reasons (e.g. Human error). Using this plot, you can find the number of files of each modality for all sessions and tell which files are missing.
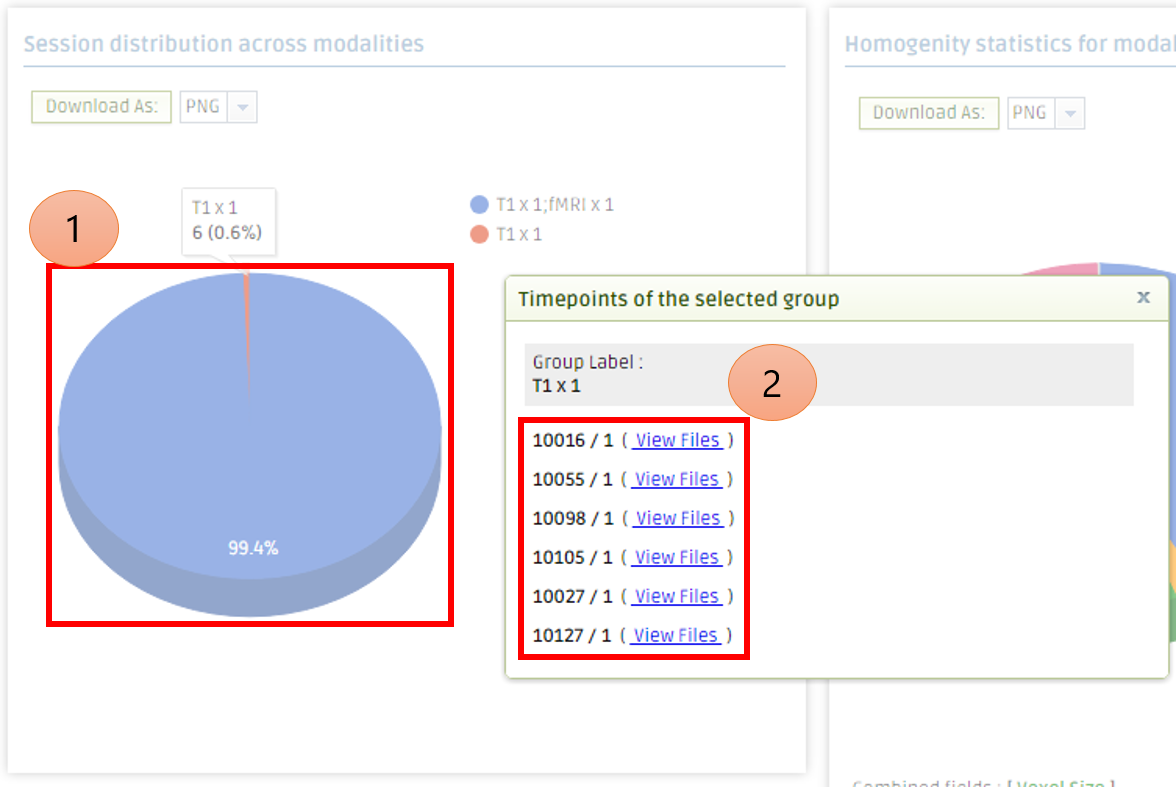
If you click in an area of the plot, the list of the included sessions is shown with the appropriate links. You can browse the files to check the session files immediately. If the slice of pie is too small to click, click on the corresponding list element on the right-hand side. This will return you the same list of sessions.
- Click on an area to show the list of sessions
- Click on a link to show the files
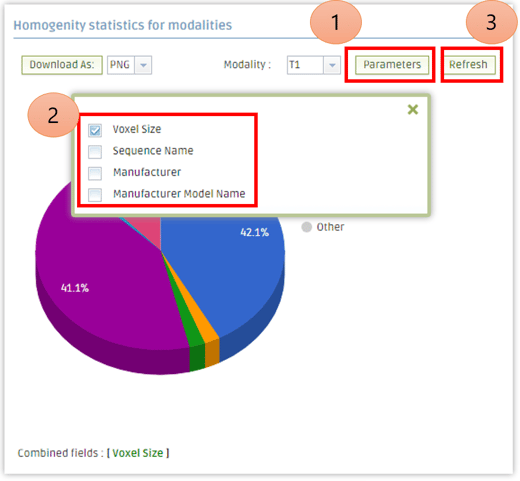
2. Homogeneity statistics for modalities
MRI has a lot of parameters and different file formats depending on the hardware vendor, whether Siemens, GE, Philips and so on. When these parameters are different in one project, analysis results can be inconsistent.
With this plot, you can quickly browse the distribution of voxel size, sequence name, manufacturer, and manufacturer model name. On the top right-hand corner, you can select modality. You can also select the specific parameter to be presented in the legend by clicking "Parameters" and then "Refresh".
- Click on the ‘Parameters’
- Select parameters to be presented
- Click on the ‘Refresh’
3. Data QA
The quality of uploaded data might be low due to technical reasons. In the ‘My Data’ tab, you can mark as ‘Pass’ or ‘Fail’ based on your Quality Assurance procedure for each session.
With this plot, you can browse the distribution of QA results.
4. Analysis QA
The analysis results might differ from what you expected for a variety of reasons. In the ‘My Analysis tab’, you can mark as ‘Pass’ or ‘Fail’ based on your Quality Assurance procedure for each analysis.
In this plot, you can select the type of analysis and browse the distribution of QA results.
Create free account now!